quinta-feira, 19 de setembro de 2013

As Supernovas


Supernova


Crab supernova 
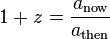
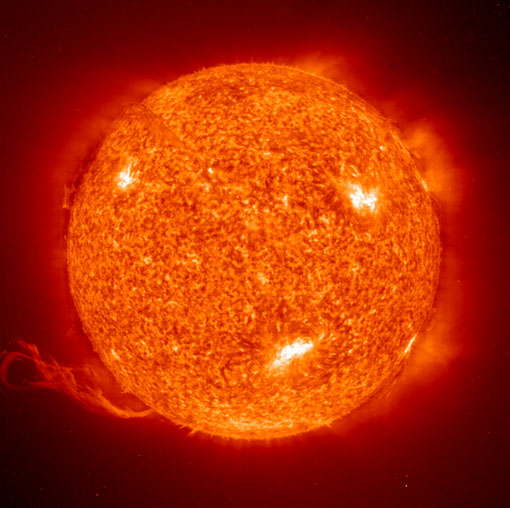
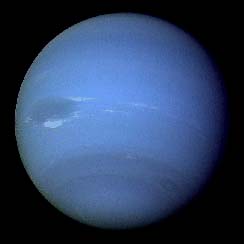
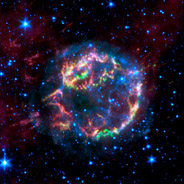
Uma supernova é a explosão de uma estrela maciça supergigante. Pode brilhar com o brilho de 10 bilhões de sóis! A produção total de energia pode ser 1E44 joules, tanto quanto a produção total do sol durante os seus 10000000000 anos de vida. O cenário mais provável é que a fusão começa a construir um núcleo de ferro. O "iron group" de elementos à volta de um número de massa A = 60 são os elementos com o núcleo mais ligado, e já não pode ser obtida energia a partir da sua fusão nuclear.
Na verdade, quer a fissão ou fusão de elementos do grupo de ferro irá absorver uma quantidade dramática de energia - como o filme de uma explosão nuclear a correr no sentido inverso. Se o aumento da temperatura de colapso gravitacional sobe o suficiente para fundir o ferro, a absorção quase instantânea de energia irá causar um colapso rápido para aquecer e reiniciar o processo. 

Fora de controle, o processo pode ocorrer aparentemente na ordem de segundos depois de uma vida da estrela de milhões de anos. Eletrões e protões fundem-se em neutrões, e a emissão de um grande número de neutrinos. As camadas externas será opaco para os neutrinos, então a onda de choque dos neutrino transportará a matéria numa grande explosão cataclísmica.

Cassiopeia A supernova 

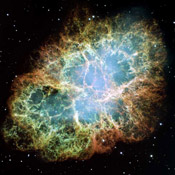
As Supernovas são classificadas como Type I ou Type II dependendo das suas formas das suas curvas de luz e da natureza do seu espetro.


The synthesis of the heavy elements is thought to occur in supernovae, that being the only mechanism which presents itself to explain the observed abundances of heavy elements.

Supernovas Tipo I e Tipo II 

Supernovae are classified as Type I if their light curves exhibit sharp maxima and then die away gradually. The maxima may be about 10 billion solar luminosities. Type II supernovae have less sharp peaks at maxima and peak at about 1 billion solar luminosities. They die away more sharply than the Type I. Type II supernovae are not observed to occur in elliptical galaxies, and are thought to occur in Population I type stars in the spiral arms of galaxies. Type I supernovae occur typically in elliptical galaxies, so they are probably Population II stars.

With the observation of a number of supernova in other galaxies, a more refined classification of supernovae has been developed based on the observed spectra. They are classified as Type I if they have no hydrogen lines in their spectra. The subclass type Ia refers to those which have a strong silicon line at 615 nm. They are classified as Ib if they have strong helium lines, and Ic if they do not. Type II supernovae have strong hydrogen lines. These spectral features are illustrated below for specific supernovae.

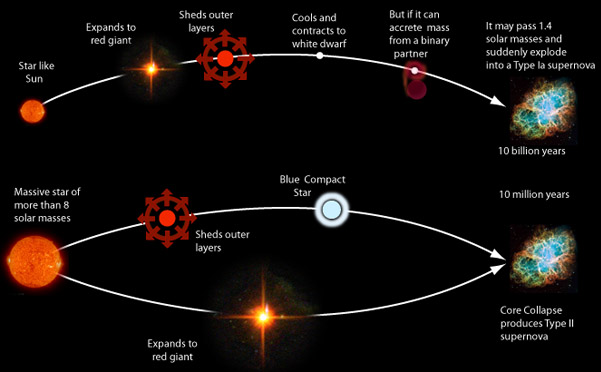
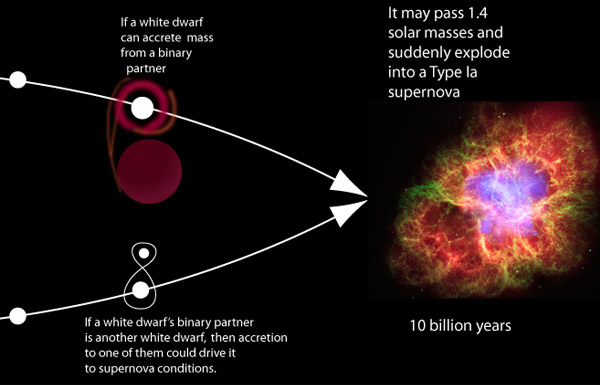
Supernovae are classified as Type I if their light curves exhibit sharp maxima and then die away smoothly and gradually. The model for the initiation of a Type I supernova is the detonation of a carbon white dwarf when it collapses under the pressure of electron degeneracy. It is assumed that the white dwarf accretes enough mass to exceed the Chandrasekhar limit of 1.4 solar masses for a white dwarf. The fact that the spectra of Type I supernovae are hydrogen poor is consistent with this model, since the white dwarf has almost no hydrogen. The smooth decay of the light is also consistent with this model since most of the energy output would be from the radioactive decay of the unstable heavy elements produced in the explosion.

Type II supernovae are modeled as implosion-explosion events of a massive star. They show a characteristic plateau in their light curves a few months after initiation. This plateau is reproduced by computer models which assume that the energy comes from the expansion and cooling of the star's outer envelope as it is blown away into space. This model is corroborated by the observation of strong hydrogen and helium spectra for the Type II supernovae, in contrast to the Type I. 

There should be a lot of these gases in the extreme outer regions of the massive star involved.
Type II supernovae are not observed to occur in elliptical galaxies, and are thought to occur in Population I type stars in the spiral arms of galaxies. Type Ia supernovae occur in all kinds of galaxies, whereas Type Ib and Type Ic have been seen only in spiral galaxies near sites of recent star formation (H II regions). This suggests that Types Ib and Ic are associated with short-lived massive stars, but Type Ia is significantly different. .

Supernova Tipo Ia

Type Ia supernovae have become very important as the most reliable distance measurement at cosmological distances, useful at distances in excess of 1000 Mpc.


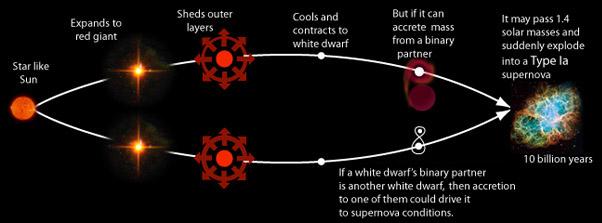
One model for how a Type Ia supernova is produced involves the accretion of material to awhite dwarf from an evolving star as a binary partner. If the accreted mass causes the white dwarf mass to exceed the Chandrasekhar limit of 1.44 solar masses, it will catastrophically collapse to produce the supernova. Another model envisions a binary system with a white dwarf and another white dwarf or a neutron star, a so-called "doubly degenerate" model. As one of the partners accretes mass, it follows what Perlmutter calls a "slow, relentless approach to a cataclysmic conclusion" at 1.44 solar masses. A white dwarf involves electron degeneracyand a neutron star involves neutron degeneracy.


A critical aspect of these models is that they imply that a Type Ia supernova happens when the mass passes the Chandrasekhar threshold of 1.44 solar masses, and therefore all start at essentially the same mass. One would expect that the energy output of the resulting detonation would always be the same. It is not quite that simple, but they seem to have light curves that are closely related, and can be related to a common template.

Carroll and Ostlie summarize the character of a Type Ia supernova with the statement that at maximum light they reach an average maximum magnitude in the blue and visible wavelength bands of
with a typical spread of less than about 0.3 magnitudes. Their light curves vary in a systematic way: the peak brightnesses and their subsequent rate of decay are inversely proportional.


The above illustration is a qualitative sketch of the data reported by Perlmutter, Physics Today 56, No.4, 53, 2003. It illustrates the results of careful study of supernova Type Ia light curves which has led to two approaches for standardizing those curves. The above curves illustrate the "stretch method" in which the curves have been stretched or compressed in time, and the standardized peak magnitude determined by the stretch factor.

With such a stretch, all the observed curves on the left converge to the template curve on the right with very little scatter. Another method for standardizing the curves is called the multicolor light curve shapes (MCLS) method. It compares the light curves to a family of parameterized light curves to give the absolute magnitude of the supernova at maximum brightness.


The MCLS method allows the reddening and dimming effect of interstellar dust to be detected and removed.Carroll and Ostlie give as an example of distance determination the Type Ia supernova SN 1963p in the galaxy NGC 1084 which had a measured apparent blue magnitude of B = m = 14.0 at peak brilliance. There was a measured extinction of A = 0.49 magnitude. Using the template maximum of M=19.6 as a standard candle gives a distance to the supernova

Distance uncertainties for Type Ia supernovae are thought to approach 5% or an uncertainty of just 0.1 magnitude in the distance modulus, m-M.

Evidencia para um Universo em aceleração

One of the observational foundations for the big bang model of cosmology was the observed expansion of the universe. Measurement of the expansion rate is a critical part of the study, and it has been found that the expansion rate is very nearly "flat". That is, the universe is very close to the critical density, above which it would slow down and collapse inward toward a future "big crunch". One of the great challenges of astronomy and astrophysics is distance measurement over the vast distances of the universe.

Since the 1990s it has become apparent that type Ia supernovae offer a unique opportunity for the consistent measurement of distance out to perhaps 1000 Mpc. Measurement at these great distances provided the first data to suggest that the expansion rate of the universe is actually accelerating. That acceleration implies an energy density that acts in opposition to gravity which would cause the expansion to accelerate. This is an energy density which we have not directly detected observationally and it has been given the name "dark energy".

The type Ia supernova evidence for an accelerated universe has been discussed by Perlmutter and the diagrams below follows his illustration in Physics Today.


The data summarized in the illustration above involve the measurement of there dshifts of the distant supernovae. The observed magnitudes are plotted against the redshift parameter z. Note that there are a number of Type 1a supernovae around z=.6, which with a Hubble constant of 71 km/s/mpc is a distance of about 5 billion light years.
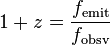
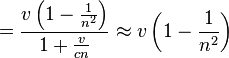
VIDEO - THC - Supernovas

quarta-feira, 18 de setembro de 2013

Red-shift - Medida de distância


REDSHIFT

In physics, redshift happens when light or other electromagnetic radiation from an object moving away from the observer is increased in wavelength, or shifted to the red end of the spectrum. In general, whether or not the radiation is within the visible spectrum, "redder" means an increase in wavelength – equivalent to a lower frequency and a lower photon energy, in accordance with, respectively, the wave and quantum theories of light.

Redshifts are an example of the Doppler effect, familiar in the change in the apparent pitches of sirens and frequency of the sound waves emitted by speeding vehicles. A redshift occurs whenever a light source moves away from an observer. Cosmological redshift is seen due to the expansion of the universe, and sufficiently distant light sources (generally more than a few million light years away) show redshift corresponding to the rate of increase in their distance from Earth.


Finally, gravitational redshifts are a relativistic effect observed in electromagnetic radiation moving out of gravitational fields. Conversely, a decrease in wavelength is called blueshift and is generally seen when a light-emitting object moves toward an observer or when electromagnetic radiation moves into a gravitational field.

Although observing redshifts and blueshifts have several terrestrial applications (such as Doppler radar and radar guns), redshifts are most famously seen in the spectroscopic observations of astronomical objects.

A special relativistic redshift formula (and its classical approximation) can be used to calculate the redshift of a nearby object when spacetime is flat. However, many cases such as black holes and Big Bang cosmology require that redshifts be calculated using general relativity.


Special relativistic, gravitational, and cosmological redshifts can be understood under the umbrella of frame transformation laws. There exist other physical processes that can lead to a shift in the frequency of electromagnetic radiation, including scattering and optical effects; however, the resulting changes are distinguishable from true redshift and not generally referred to as such (see section on physical optics and radiative transfer).

Redshift (and blueshift) may be characterized by the relative difference between the observed and emitted wavelengths (or frequency) of an object. In astronomy, it is customary to refer to this change using a dimensionless quantity called z. If λ represents wavelength and f represents frequency (note, λf = c where c is the speed of light), then z is defined by the equations:

Calculation of redshift, z
Based on wavelengthBased on frequency
z = \frac{\lambda_{\mathrm{obsv}} - \lambda_{\mathrm{emit}}}{\lambda_{\mathrm{emit}}}z = \frac{f_{\mathrm{emit}} - f_{\mathrm{obsv}}}{f_{\mathrm{obsv}}}
1+z = \frac{\lambda_{\mathrm{obsv}}}{\lambda_{\mathrm{emit}}}1+z = \frac{f_{\mathrm{emit}}}{f_{\mathrm{obsv}}}

After z is measured, the distinction between redshift and blueshift is simply a matter of whether z is positive or negative. See the formula section below for some basic interpretations that follow when either a redshift or blueshift is observed.

For example, Doppler effect blueshifts (z < 0) are associated with objects approaching (moving closer to) the observer with the light shifting to greater energies. Conversely, Doppler effect redshifts (z > 0) are associated with objects receding (moving away) from the observer with the light shifting to lower energies. Likewise, gravitational blueshifts are associated with light emitted from a source residing within a weaker gravitational field as observed from within a stronger gravitational field, while gravitational redshifting implies the opposite conditions.

Redshift formulae

In general relativity one can derive several important special-case formulae for redshift in certain special spacetime geometries, as summarized in the following table. In all cases the magnitude of the shift (the value of z) is independent of the wavelength.[2]

Redshift Summary
Redshift typeGeometryFormula[22]
Relativistic DopplerMinkowski space (flat spacetime)1 + z = \gamma \left(1 + \frac{v_{\parallel}}{c}\right)
z \approx \frac{v_{\parallel}}{c} for small v
1 + z = \sqrt{\frac{1+\frac{v}{c}}{1-\frac{v}{c}}} 
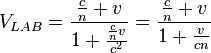
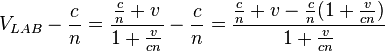
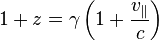
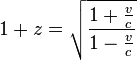
for motion completely in the radial direction.
1 + z=\frac{1}{\sqrt{1-\frac{v^2}{c^2}}} for motion completely in the transverse direction.
Cosmological redshiftFLRW spacetime (expanding Big Bang universe)1 + z = \frac{a_{\mathrm{now}}}{a_{\mathrm{then}}}
Gravitational redshiftany stationary spacetime (e.g. the Schwarzschild geometry)1 + z = \sqrt{\frac{g_{tt}(\text{receiver})}{g_{tt}(\text{source})}}
(for the Schwarzschild geometry, 1 + z = \sqrt{\frac{1 - \frac{2GM}{ c^2  r_{\text{receiver}}}}{1 - \frac{2GM}{ c^2 r_{\text{source} }}}}

Fizeau experiment

The Fizeau experiment was carried out by Hippolyte Fizeau in 1851 to measure the relative speeds of light in moving water. Fizeau used a special interferometer arrangement to measure the effect of movement of a medium upon the speed of light.
According to the theories prevailing at the time, light traveling through a moving medium would be dragged along by the medium, so that the measured speed of the light would be a simple sum of its speed throughthe medium plus the speed of the medium. Fizeau indeed detected a dragging effect, but the magnitude of the effect that he observed was far lower than expected. His results seemingly supported the partial aether-drag hypothesis of Fresnel, a situation that was disconcerting to most physicists. Over half a century passed before a satisfactory explanation of Fizeau's unexpected measurement was developed with the advent of Albert Einstein's theory of special relativity. Einstein later pointed out the importance of the experiment for special relativity.

Although it is referred to as the Fizeau experiment, Fizeau was an active experimenter who carried out a wide variety of different experiments involving measuring the speed of light in different situations.


Experimental setup
Setup of the Fizeau Experiment (1851).

A light ray emanating from the source S' is reflected by a beam splitter G and is collimated into a parallel beam by lens L. After passing the slits O1 and O2, two rays of light travel through the tubes A1 and A2, through which water is streaming back and forth as shown by the arrows. The rays reflect off a mirror m at the focus of lens L', so that one ray always propagates in the same direction as the water stream, and the other ray opposite to the direction of the water stream. 

After passing back and forth through the tubes, both rays unite at S, where they produce interference fringes that can be visualized through the illustrated eyepiece. The interference pattern can be analyzed to determine the speed of light traveling along each leg of the tube.

Hoek experiment

An indirect confirmation of Fresnel's dragging coefficient was provided by Martin Hoek (1868). His apparatus was similar to Fizeau's, though in his version only one arm contained an area filled with resting water, while the other arm was in the air. As seen by an observer resting in the aether, Earth and hence the water is in motion. So the following travel times of two light rays traveling in opposite direction were calculated by Hoek (neglecting the transverse direction, see image):

t_{1}=\frac{AB}{c+v}+\frac{DE}{\frac{c}{n}-v}
t_{2}=\frac{AB}{c-v}+\frac{DE}{\frac{c}{n}+v}
HoekExperiment with expected results.png


The travel times are not the same, which should be indicated by an interference shift. However, if Fresnel's dragging coefficient is applied to the water in the aether frame, the travel time difference (to first order in v/c) vanishes. Using different setups Hoek actually obtained a null result, confirming Fresnel's dragging coefficient. (For a similar experiment refuting the possibility of shielding the aether wind, see Hammar experiment).

In the particular version of the experiment shown here, Hoek used a prism P to disperse light from a slit into a spectrum which passed through a collimator C before entering the apparatus. With the apparatus oriented parallel to the hypothetical aether wind, Hoek expected the light in one circuit to be retarded 7/600 mm with respect to the other. Where this retardation represented an integral number of wavelengths, he expected to see constructive interference; where this retardation represented a half-integral number of wavelengths, he expected to see destructive interference. In the absence of dragging, his expectation was for the observed spectrum to be continuous with the apparatus oriented transversely to the aether wind, and to be banded with the apparatus oriented parallel to the aether wind. His actual experimental results were completely negative.

Derivation in special relativity

Einstein showed how Lorentz's equations could be derived as the logical outcome of a set of two simple starting postulates. In addition Einstein recognized that the stationary aether concept has no place in special relativity, and that the Lorentz transformation concerns the nature of space and time. Together with the moving magnet and conductor problem, the negative aether drift experiments, and the aberration of light, the Fizeau experiment was one of the key experimental results that shaped Einstein's thinking about relativity.Robert S. Shankland reported some conversations with Einstein, in which Einstein emphasized the importance of the Fizeau experiment:

He continued to say the experimental results which had influenced him most were the observations of stellar aberration and Fizeau’s measurements on the speed of light in moving water. “They were enough,” he said.

Max von Laue (1907) demonstrated that the Fresnel drag coefficient can be easily explained as a natural consequence of the relativistic formula for addition of velocities, namely:The speed of light in immobile water is c/n.From the velocity composition law it follows that the speed of light observed in the laboratory, where water is flowing with speed v (in the same direction as light) is


Thus the difference in speed is (assuming v is small comparing to c, approximating to the first non-trivial correction


This is accurate when v/c << 1, and agrees with the formula based upon Fizeau's measurements, which satisfied the conditionv/c << 1.

Fizeau's experiment is hence supporting evidence for the collinear case of Einstein's velocity addition formula.


segunda-feira, 16 de setembro de 2013

Anãs brancas


Anãs brancas

Quando o processo triplo-alfa em uma estrela gigante vermelha é completa, as evoluções de estrelas com menos de 4 massas solares não têm energia suficiente para acender o processo de fusão de carbono.  Colapsam, movendo-se para baixo e para a esquerda da sequência principal até o seu colapso ser interrompido pela pressão decorrente da degeneração dos eletrões. Um exemplo interessante de uma anã branca é a Sirius-B, mostrada na comparação com o tamanho da Terra abaixo. O sol deverá seguir o padrão indicado para o estágio de anã branca.

1 colher de chá de uma anã branca iria pesar 5 toneladas. Uma anã branca com massa solar seria aproximadamente do tamanho da Terra


A da esquerda pode ser uma futura anã branca na nebulosa Helix. À direita é a anã branca quente NGC2440. Ambas são cercadas por "casulos" de gás que expulsam em seu colapso em direção ao estado anã branca.

Outra provável anã branca pode ser vista  na IC-5148 .


Sirius-B

A anã branca Sirius-B não foi vista até 1862, mas foi prevista em 1844 a partir do movimento de Sirius-A.

O espectro de corpo negro de Sirius-B tem picos a 110 nm, correspondendo a uma temperatura de 26.000 K. A partir da magnitude absoluta conhecida, o raio é calculado para ser apenas a 4200 km. Menor do que a Terra, é quase tão massiva como o sol.

T


Degeneração de eletrões 

A degeneração de eletrões, é uma aplicação estelar do Princípio de Exclusão de Pauli, como a degeneração de neutrões. Dois eletrões não podem ocupar estados idênticos, mesmo sob a pressão de uma estrela em colapso de várias massas solares. Para massas estelares menores do que 1,44 de massas solar, a energia a partir do colapso gravitacional não é suficiente para produzir os neutrões de uma estrela de neutrões, de modo que o colapso é interrompido pela degeneração dos elétrons para formar anãs brancas.

Esta massa máxima para uma anã branca é chamada o limite de Chandrasekhar. Quando as estrelas se contraem, todos os níveis mais baixos de energia dos eletrões são preenchidos e os elétrons são forçados a níveis de energia mais elevados, enchendo os níveis mais baixos de energia desocupados. Isto cria uma pressão efectiva que evitam mais colapso gravitacional

Sirius-A

 A estrela Sirius, referida como a Sirius-A, é talvez a mais notável para o estudo do "companheiro de Sirius" ou Sirius-B, que foi o primeiro exemplo de uma estrela anã branca a ser estudada. Próprio Sirius é uma das estrelas mais brilhantes no céu, estando apenas a 8,6 anos-luz de distância de nós.

Também é notável por ser o tema de um dos primeiros estudos sérios sobre o ciclo de carbono da fusão nuclear. É muito mais quente do que o nosso Sol e ficou claro que algum processo que não seja a fusão próton-próton estava ocorrendo para produzir toda essa energia.


domingo, 15 de setembro de 2013

O Sistema Solar

O Sistema Solar

Sun

NASA image
Mass (Earth=1)332,800
Mean diameter (106 m)1392
Rotation period26-37 d
Mean distance to Earth, 106 km149
Density (water=1)1.41
Surface gravity m/s2274
Earth's Sun is a medium-sized star which lies on the main sequence with 90% of the known stars. It has a effective surface temperature is 5780 K, putting it in spectral class G2. Its mass is 1.989 x 1030 kg and its mean radius is 6.96 x 10⁸meters. The mass of the sun is over 99.8% of the mass of the entire known solar system, leading de Pater and Lissauer to refer lightly to the solar system as "the Sun plus some debris".

Another interesting item of perspective is that "95% of all stars are less massive than the sun"(Ward & Brownlee).

The sun radiates energy at the rate of 3.85 x1026 watts. Just outside the earth's atmosphere solar energy is received, assuming normal incidence, at the rate of 1340 watts per square meter.

The orbit of Earth ranges from 1.47 to 1.52 x 10¹¹ meters from the Sun. The average light travel time to the earth is 8.3 minutes.

The radius of the sun at 696,000 km is 109 times the Earth's radius. Its surface gravity is 274 m/s2 or 28.0 times that of the Earth. Its mean density is 1410 kg/m3 or 0.255 times the mean density of Earth.


The Sun's diameter of 1,392,000 km is 109 times the Earth's equatorial diameter of 12,756 km. The distance to the Earth from the sun at 149,000,000 km = 1 AU is 107 times the diameter of the Sun and 388 times the Earth-Moon distance. 

The Earth-Moon distance is not shown to scale in the above composite. The diameter of the Sun is 3.6 times the Earth-Moon distance. Above, the Earth and Moon are scaled relative to an image of the Sun made by the SOHOsatellite on January 12, 2007.

The composition of the sun is 71% hydrogen, 27.1% helium and less than 2% of all other elements. The center temperature is modeled to be 15.5 million K. The Sun is fueled by the proton cycle of nuclearfusion. Escape velocity = 618 km/s

Being a gaseous body, the Sun does not have a single period of rotation like a rigid body. The sunspots provide a convenient reference for the measurement of the rotation period at different latitudes. The period of rotation averages 25.4 days, varying from 34.4 days at the poles to 25.1 days at the equator (Chaisson). Its axis is tilted 7.25° relative to the ecliptic.
The visible surface of the Sun (the photosphere) has a granular appearance with a typical dimension of a granule being 1000 kilometers. The image at right is from the NASA Solar Physics website and is credited to G. Scharmer and the Swedish Vacuum Solar Telescope. The granules are described as convection cells which transport heat from the interior of the Sun to the surface.
The Sun's apparent magnitude is -26.8 and its absolute magnitude is +4.8 . Its greatest angular diameter as seen from the Earth is 32.5' . The sun is 7.7 kpc or 25,000 light years from the center of the galaxy and orbits the galaxy in about 200 million years. This corresponds to an orbital velocity of 230 km/s.

Asteroids

Asteroids are minor planets, most of which orbit the Sun between Mars and Jupiter. Their orbits are typically more eccentric than those of the planets. The largest asteroid, Ceres, is 940 kilometers in diameter and has about 1/10000 the mass of the Earth. With over 7000 asteroids catalogued, the total number may exceed 100,000. However, their combined mass is less than 1/10 that of the Earth's Moon.
All solid bodies in our Solar System show craters where they have collided with asteroids and comets.

A few asteroids cross the Earth's orbit. The most notable of these are Apollo, Icarus, Adonis, and Eros. Hector has an orbit similar to that of Jupiter, and Hidalgo has a large elliptical orbit which extends from about the orbit of Mars out well beyond the orbit of Jupiter.

Asteroid Gaspra was used in slingshot maneuver with Galileo in 1991 on the way toward ultimate rendevouz with Jupiter. Galileo also provided a close view of asteroid Ida.


The vast majority of the meteorites that hit the Earth are thought to come from the asteroid belt.
Asteroids are classified from their observed reflectivity, with C-type asteroids making up about 75% of them. C-type or carbonaceous asteroids are dark from the high content of carbon in them. S-type asteroids contain silicate and are more reflective - they make up about 15% of the asteroids. Most of the remaining asteroids are called M-type and contain large fractions of iron and nickel. The C-type asteroids are supposed to be very primitive material that has not been significantly heated or changed chemically since they were formed some 4.6 billion years ago.

Comets

Comets are small asteroid-like bodies when they are far from the Sun, traveling in highly ellipical orbits about the Sun. When they sweep in close to the Sun, dramatic changes occur as they brighten and develop an extended tail. The nucleus is widely described as a "dirty snowball" composed of ice and some rocky debris.


Halley's Comet
There is considerable vaporization as they approach the Sun and they develop ion tails and dust tails. The ion tails are almost straight streamers from the nucleus while the usually brighter dust tails are broad and diffuse and curve slightly, lagging behind the radial direction.
The lighter ionized gas atoms of the ion tale cause it to point outward, directly away from the Sun, because the influence of the solar wind is dominant. I take the lower, more focused part of the tail in the image above to be the ion tail. The dust tail is made up of more massive particles and the role of gravity is important. If particles influenced by gravity are moved to an orbit further from the Sun, their radial direction falls behind that of the nucleus of the comet because their orbital period will be longer.

The upper part of the Halley image would then appear to be the dust tail - you can see a slight curvature. In its most visible phase close to the Sun, the comet has a small solid nucleus and a ball of gas around it called the coma. Comas have been found to be on the order of 100,000 km in diameter at their maximum size, comparable to the largest planets. Most aof the light reflection is from the coma. Surrounding the coma and the visible tails is a hydrogen envelope which may extend millions of kilometers. The light from comets is purely reflected light; like the planets, the comets produce no light of their own.

Current models of the nuclei of comets view them as balls of loosely packed ices, a cold mixture containing gas and dust. The dust is thought to be trapped in a mixture of methane, ammonia, and water ice. The smaller moons of the outer solar system are similar in constitution. Since they spend most of their time far from the Sun, their temperatures are thought to be a few tens of kelvins. Chaisson & McMillan suggest a core temperature of 200K and a surface temperature on the order of 350K for Halley when it made its close approach to the Sun.

The short-period comets (less than 200 years) are thought to originate in a region of the solar system out past the orbit of Neptune called the Kuiper belt (30 to 100 AU). Most of them are found to have prograde orbits (in the same orbital direction as the planets) and to be close to the ecliptic plane. The Kuiper belt is described as a region of asteroid-like comets, most of which travel in roughly circular orbits. It may be that occasional close encounters between comets or the cumulative gravitational pull of the outer planets brings one into the higly elliptical orbit which brings it close to the Sun.

Other comets, characterized as "long-period comets", are found in random orientations with respect to the ecliptic plane. They are thought to originate in a large "cloud" of objects in a region perhaps 50,000 AU from the Sun called the Oort cloud.

While the most famous comet is Halley's Comet, some interesting recent encounters have been with comet Giacobini-Zinner and the impact of cometShoemaker-Levy 9 on Jupiter.

This image of comet Schwassmann-Wachmann 3 taken by Tim Puckett of Villa Rica, Ga. USA. It was obtained with a 12" Lx200 working at f/7. This is a 300 second exposure taken on 12-01-95 .

Mercury


Mass (Earth=1)0.0558
Equatorial diameter (km)4880
Period (years)0.241
Mean distance from Sun, 106 km57.9
Density (water=1)5.60
Surface gravity m/s23.78

The cliffs and craters (up to 800 miles across) of Mercury were first imaged by NASA's Mariner 10 which passed it at an estimated distance of 705 km on Mar 29, 1974. Mercury's wrinkled surface may be the result of the planet shrinking as it cooled after formation 4.5 billion years ago. Mariner 10 passed by again on Sep 21, 1974 at 48,069 km and a third time on Mar 16, 1975 at a distance of 307 km. Next to the exceptional orbit of Pluto, Mercury has the orbit with the greatest eccentricity (e = .208) and the greatest inclination to the ecliptic plane ( 7°).

Mercury's small orbit keeps it so close to the Sun that, when viewed from Earth, Mercury is almost always seen in twilight. Mercury receives the maximum amount of sunlight, but its albedo is only 0.1 compared with 0.39 for the Earth, so it is not as bright as it would be with a higher albedo.

Venus


Mass (Earth=1)0.815
Equatorial diameter (km)12,100
Period (years)0.615
Mean distance from Sun, 10^6 km108
Density (water=1)5.20
Surface gravity m/s^28.60

The brightest planet as seen from Earth, Venus swings from one side of the Sun to the other, alternating as our brilliant "Evening Star" and "Morning Star," each seen for about 8 months at a time.


The carbon dioxide atmosphere and sulfuric acid clouds of Venus allow sunlight in but don't let the heat back out, trapping it like the glass in a greenhouse and making Venus the hottest of planets. The flyby of Mariner 2in 1962 indicated a surface temperature of about 400 C. One of the discoveries of Mariner 2 was that Venus has no measurable magnetic field, even though its density indicates an iron core similar to that of the Earth. 

The presumption is that its slow rotation (period 243 Earth days) is insufficient to create the kind of dynamo effect which produces the Earth's magnetic field. Mariner 5 passed closer to Venus, swinging by at 2900 km. Venus was used in a slingshot maneuver to boost Mariner 10 on toward Mercury on Feb 5, 1974. 

Its closest approach to Venus was 5770 km. The exploration of the atmosphere and surface of Venus was a major goal of the Russian space program in their extended Venera series of spacecraft. The Venera explorations provide the only direct data we have on the surface of Venus. The Magellan orbiter provided a much more detailed radar map of the surface than the previous explorations, bringing the number of Venus exporation missions to about 20.

Earth


Mass (Earth=1)1.00
Equatorial diameter (km)12,800
Period (years)1.00
Mean distance from Sun, 106km150
Density (water=1)5.52
Surface gravity m/s29.78

Earth is the only planet with liquid water on its surface. In fact, 70% of the Earth is covered by water.

Our oceans and air were formed by gases seeping from the Earth as it cooled after formation. Fossils indicate that life began on Earth at least 3.5 billion years ago.

Mars


Mass (Earth=1)0.107
Equatorial diameter (km)6,790
Period (years)1.88
Mean distance from Sun, 10^6 km228
Density (water=1)3.95
Surface gravity m/s^23.72

The Red Planet features ice caps of carbon dioxide and water, a volcano 15 miles high (Olympus Mons), a canyon 3,000 miles long and 4 miles deep (the great rift valley, Valles Marinerus), and dry river channels. Many such features were explored in 1971-72 by the Mariner-9 craft.

The later Viking landers performed surface tests, looking for evidence of life.
Perhaps Mars, now locked in an ice age, once had a denser atmosphere and liquid water on its surface. But NASA's two

Viking landers (1976) found no life.


Moons of Mars


Deimos


Phobos

Jupiter


Mass (Earth=1)318
Equatorial diameter (km)143,000
Period (years)11.9
Mean distance from Sun, 106 km778
Density (water=1)1.31
Surface gravity m/s222.9


With over twice as much mass as all the other planets and moons combined, Jupiter still has 50 times too little mass to be a star. It is 318 times as massive as the Earth. It is mostly composed of hydrogen and helium, but is thought to have a heavy element core on the order of 10 times the mass of the Earth.

The Great Red Spot, larger than two Earths, rages like a hurricane in Jupiter's turbulent atmosphere. Heat from Jupiter's 29,700°C (53,500°F) core keeps the atmosphere churning.

Voyager photographs showed extensive lightning activity in the atmosphere of Jupiter, and uv photographs indicate auroral activity.


The small rocky moons of Mars, Deimos and Phobos, are irregular in shape and comparable in size to the asteroid Gaspra. The three objects are shown at the same scale and almost the same lighting conditions in the image linked below. All three bodies have irregular shapes, testament to their violent histories. Their surfaces are distinctly different, most likely because of very different impact histories.

The Gaspra image was taken by the Galileo spacecraft on October 29, 1991 and the images of Deimos and Phobos were taken by VikingOrbiter in 1977. The images are from NASA.


Jupiter's Moons


Montage of Jupiter and the Galilean satellites Io, Europa, Ganymede and Callisto. The images are not to scale, but are in their relative positions. At upper left, the reddish Io is nearest Jupiter. Then Europa in center, then Ganymede and Callisto at the lower right. Image credit NASA, Jet Propulsion Laboratory. These images are from Voyager I.

Name
Distance from Jupiter
Orbit Period
Size
106 m
Jupiter radii
(days)
(Longest
diameter, km)
Metis
128
1.79
0.29
40
Adastea
129
1.80
0.30
20
Amalthea
181
2.54
0.50
260
Thebe
222
3.10
0.67
100
Io
422
5.90
1.77
3640
Europa
671
9.38
3.55
3130
Ganymede
1,070
15.0
7.15
5270
Callisto
1,880
26.3
16.7
4800
Leda
11,100
155
239
10
Himalia
11,500
161
251
170
Lysithea
11,700
164
259
24
Elara
11,700
164
260
80
Ananke
21,200
297
631*
20
Carme
22,600
316
692*
30
Pasiphae
23,500
329
735*
36
Sinope
23,700
332
758*
28
* Indicates retrograde orbit.
The four largest moons are comparable to the Earth's Moon in size. They are referred to as the Galilean moons. Their orbits are direct (in the same direction as the planet's rotation), their orbits are roughly circular, and they lie close to Jupiter's equatorial plane.

Io and Europa have thick rocky mantles surrounding iron/iron sulfide cores. Ganymede and Callisto are less dense, with water and water ice accounting for as much as half of their masses. Ganymede does have a small metallic core, as evidenced by the fact that it has a magnetic field, but Callisto is apparently a largely undifferentiated mixture of rock and ice.

Additional Data for the Galilean Moons

Name
Mass
(Earth moon masses)
Density
kg/m3
Io
1.22
3500
Europa
0.65
3000
Ganymede
2.02
1900
Callisto
1.46
1900

The outer moons are in two groups of four each at about the same orbit radius. The moons of the inner group move in eccentric, inclined orbits at about 11 million kilometers, and those of the outer group move in eccentric orbits at about 22 million kilometers which are retrograde to the planets rotation. It is likely that each group came from the breakup of a single body which was captured by Jupiter's gravity.

Saturn


A gas giant like Jupiter, Saturn is the least dense of all the planets, 70% as dense as water. If Saturn could be dropped into a gigantic tub of water, it would float. Saturn, like Jupiter, is mostly composed of hydrogen and helium, but is thought to have a heavy element core on the order of10 times the mass of the Earth.

Saturn's ring system is visible with a small telescope. NASA's Voyager space-probes revealed that the rings number more than a thousand. Present understanding is that the rings did not form with the planet but are the remains of a shattered moon or comet, formed some 100 million years ago.

The great ring is a "disk more than 180,000 miles wide but scarcely 60 ft high, making it many orders of magnitude flatter than a pancake. Ring researchers compare it to a sheet of tissue paper spread across a football field." Sobel

Mass (Earth=1)95.1
Equatorial diameter (km)120,000
Period (years)29.5
Mean distance from Sun, 106 km1,430
Density (water=1)0.704
Surface gravity m/s29.05

Saturn's Moons

Graphic from NASA/JPL and the Cassini site.

Our knowledge of the moons of Saturn was greatly increased by the Cassini Mission.Iapetus shows a brightness variation of a factor of 10, a change in intensity believed to be caused by the existence of ice on one side and black carbonaceous material on the other. ( Weisburd, Science News 133, June 11, 1988 p374) Enceladus has a heavily cratered surface; it was imaged clearly in the Voyager program. 
The moons Hyperion, Epimetheus and Dione were also imaged by Cassini. References:Cassini Mission Wiki Moons of Saturn "Alien-life hunters focus on moons in outer solar system", Nadia Drake, Science News 180, #8, Oct 8


Saturn's ring system is visible with a small telescope.

A gas giant like Jupiter, Saturn is the least dense of all the planets, 70% as dense as water. If Saturn could be dropped into a gigantic tub of water, it would float. Saturn, like Jupiter, is mostly composed of hydrogen and helium, but is thought to have a heavy element core on the order of10 times the mass of the Earth.

NASA's Voyager space-probes revealed that the rings number more than a thousand. Present understanding is that the rings did not form with the planet but are the remains of a shattered moon or comet, formed some 100 million years ago.

The great ring is a "disk more than 180,000 miles wide but scarcely 60 ft high, making it many orders of magnitude flatter than a pancake. Ring researchers compare it to a sheet of tissue paper spread across a football field." Sobel 

Uranus


Mass (Earth=1)146
Equatorial diameter (km)51,800
Period (years)84.0
Mean distance from Sun, 10^6 km2,870
Density (water=1)1.21
Surface gravity m/s^27.77

Uranus is the only planet which lies on its side as it revolves around the Sun. Because it is at the limit of naked eye visibility, Uranus was unknown until William Herschel discovered it with a telescope in 1781. The rings were revealed when they occulted a star in 1977.

Uranus and Neptune are sometimes referred to as the "ice giants", their compositions being dominated by water, ammonia (NH3), methane (CH4)' and some 'rock" composed of silicates and metals. They have a hydrogen/helium atmosphere which is thought to have a mass of around 1 - 3 times the mass of the Earth.


Uranus' Moons

The image of Uranus' moon Miranda is a computer-assembled mosaic of images obtained on Jan 24, 1986 by the Voyager 2 spacecraft. Miranda is the innermost and smallest of the five major Uranian satellites, just 480 km (300 mi) in diameter.

Nine images were combined to obtain this full-disc, south polar view, which shows the varying geologic provinces of Miranda. Miranda's surface consists of two strikingly different major types of terrain. One is an old, heavily cratered, rolling terrain with relatively uniform albedo (reflectivity).

The other is a young, complex terrain characterized by sets of bright and dark bands, scarps and ridges - features found in the regions at right and left and in the distinctive "chevron" feature below and right of center.


Neptune


Neptune is a near twin of Uranus in size, one of the gas giants.
Neptune was discovered mathematically before it was seen telescopically. The varying orbital speeds of Uranus allowed J.C. Adams and J. J. Leverrier to calculate in 1845 that an unknown planet was affecting Uranus gravitationally. In 1846, J. Galle found Neptune where the mathematicians predicted it.
Mass (Earth=1)17.2
Equatorial diameter (km)49,500
Period (years)165
Mean distance from Sun, 10^6 km4,500
Density (water=1)1.67
Surface gravity m/s^211.0

Pluto


Mass (Earth=1)0.01(?)
Equatorial diameter (km)3000(?)
Period (years)248
Mean distance from Sun, 10^6 km5,900
Density (water=1)?
Surface gravity m/s^20.3(?)


Pluto was discovered by C. Tombagh in 1930, using the same techniques by which Neptune was found. But Pluto, much smaller than expected, is too tiny to affect faraway Uranus, so it's discovery was an accident.

Pluto's moon is a surprising one-third the diameter of Puto . Both may be escaped satellites of Neptune.

Pluto's orbit is unique in that it is much more elliptical than the other planets, and it is inclined 17° to the plane of the Earth's orbit.