Supernova
As Supernovas são classificadas como Type I ou Type II dependendo das suas formas das suas curvas de luz e da natureza do seu espetro.
The synthesis of the heavy elements is thought to occur in supernovae, that being the only mechanism which presents itself to explain the observed abundances of heavy elements.
Supernovas Tipo I e Tipo II
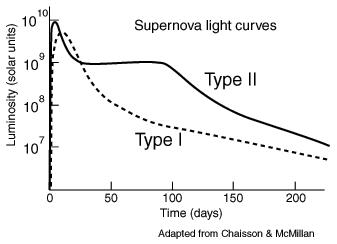
Supernovae are classified as Type I if their light curves exhibit sharp maxima and then die away gradually. The maxima may be about 10 billion solar luminosities. Type II supernovae have less sharp peaks at maxima and peak at about 1 billion solar luminosities. They die away more sharply than the Type I. Type II supernovae are not observed to occur in elliptical galaxies, and are thought to occur in Population I type stars in the spiral arms of galaxies. Type I supernovae occur typically in elliptical galaxies, so they are probably Population II stars.
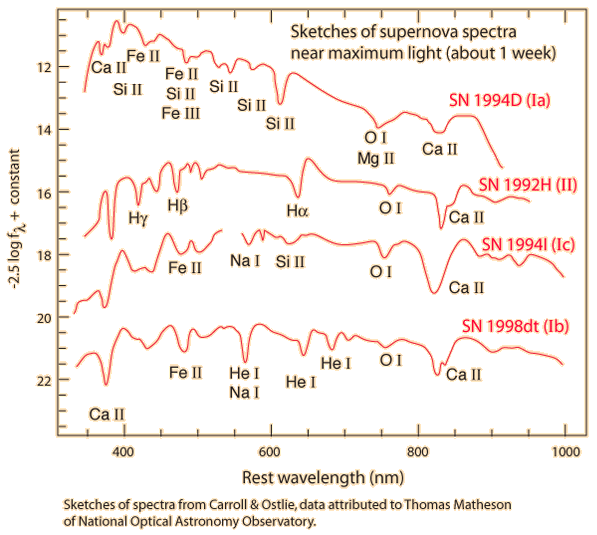
With the observation of a number of supernova in other galaxies, a more refined classification of supernovae has been developed based on the observed spectra. They are classified as Type I if they have no hydrogen lines in their spectra. The subclass type Ia refers to those which have a strong silicon line at 615 nm. They are classified as Ib if they have strong helium lines, and Ic if they do not. Type II supernovae have strong hydrogen lines. These spectral features are illustrated below for specific supernovae.
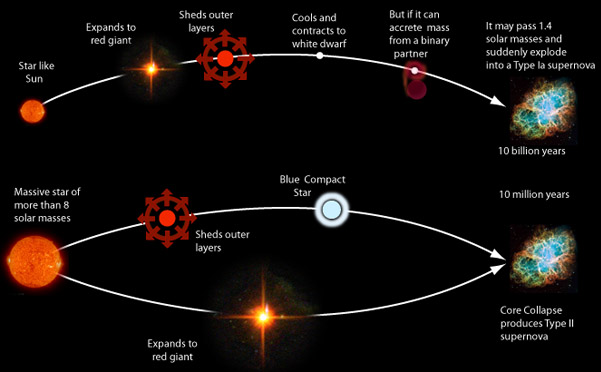
Supernovae are classified as Type I if their light curves exhibit sharp maxima and then die away smoothly and gradually. The model for the initiation of a Type I supernova is the detonation of a carbon white dwarf when it collapses under the pressure of electron degeneracy. It is assumed that the white dwarf accretes enough mass to exceed the Chandrasekhar limit of 1.4 solar masses for a white dwarf. The fact that the spectra of Type I supernovae are hydrogen poor is consistent with this model, since the white dwarf has almost no hydrogen. The smooth decay of the light is also consistent with this model since most of the energy output would be from the radioactive decay of the unstable heavy elements produced in the explosion.
Type II supernovae are modeled as implosion-explosion events of a massive star. They show a characteristic plateau in their light curves a few months after initiation. This plateau is reproduced by computer models which assume that the energy comes from the expansion and cooling of the star's outer envelope as it is blown away into space. This model is corroborated by the observation of strong hydrogen and helium spectra for the Type II supernovae, in contrast to the Type I.
There should be a lot of these gases in the extreme outer regions of the massive star involved.
Type II supernovae are not observed to occur in elliptical galaxies, and are thought to occur in Population I type stars in the spiral arms of galaxies. Type Ia supernovae occur in all kinds of galaxies, whereas Type Ib and Type Ic have been seen only in spiral galaxies near sites of recent star formation (H II regions). This suggests that Types Ib and Ic are associated with short-lived massive stars, but Type Ia is significantly different. .
Supernova Tipo Ia
Type Ia supernovae have become very important as the most reliable distance measurement at cosmological distances, useful at distances in excess of 1000 Mpc.
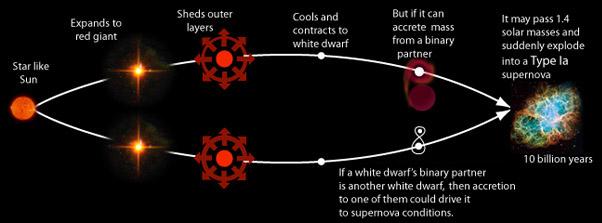
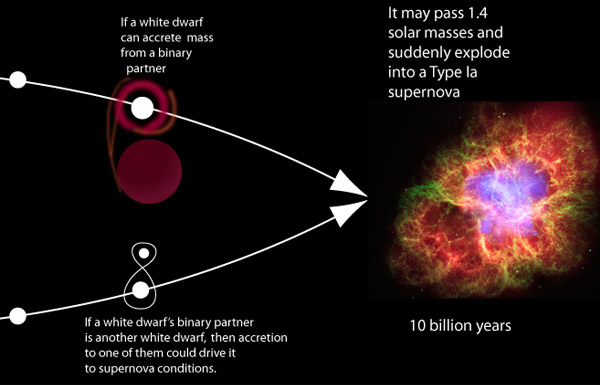
One model for how a Type Ia supernova is produced involves the accretion of material to awhite dwarf from an evolving star as a binary partner. If the accreted mass causes the white dwarf mass to exceed the Chandrasekhar limit of 1.44 solar masses, it will catastrophically collapse to produce the supernova. Another model envisions a binary system with a white dwarf and another white dwarf or a neutron star, a so-called "doubly degenerate" model. As one of the partners accretes mass, it follows what Perlmutter calls a "slow, relentless approach to a cataclysmic conclusion" at 1.44 solar masses. A white dwarf involves electron degeneracyand a neutron star involves neutron degeneracy.
A critical aspect of these models is that they imply that a Type Ia supernova happens when the mass passes the Chandrasekhar threshold of 1.44 solar masses, and therefore all start at essentially the same mass. One would expect that the energy output of the resulting detonation would always be the same. It is not quite that simple, but they seem to have light curves that are closely related, and can be related to a common template.
Carroll and Ostlie summarize the character of a Type Ia supernova with the statement that at maximum light they reach an average maximum magnitude in the blue and visible wavelength bands of 

with a typical spread of less than about 0.3 magnitudes. Their light curves vary in a systematic way: the peak brightnesses and their subsequent rate of decay are inversely proportional.
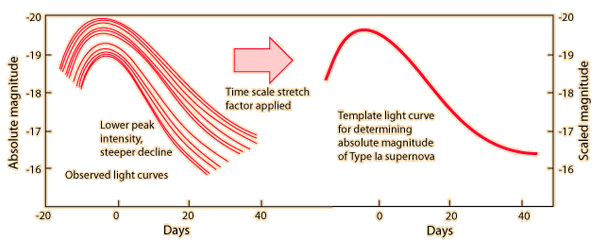
The above illustration is a qualitative sketch of the data reported by Perlmutter, Physics Today 56, No.4, 53, 2003. It illustrates the results of careful study of supernova Type Ia light curves which has led to two approaches for standardizing those curves. The above curves illustrate the "stretch method" in which the curves have been stretched or compressed in time, and the standardized peak magnitude determined by the stretch factor.
With such a stretch, all the observed curves on the left converge to the template curve on the right with very little scatter. Another method for standardizing the curves is called the multicolor light curve shapes (MCLS) method. It compares the light curves to a family of parameterized light curves to give the absolute magnitude of the supernova at maximum brightness.

The MCLS method allows the reddening and dimming effect of interstellar dust to be detected and removed.Carroll and Ostlie give as an example of distance determination the Type Ia supernova SN 1963p in the galaxy NGC 1084 which had a measured apparent blue magnitude of B = m = 14.0 at peak brilliance. There was a measured extinction of A = 0.49 magnitude. Using the template maximum of M=19.6 as a standard candle gives a distance to the supernova
Distance uncertainties for Type Ia supernovae are thought to approach 5% or an uncertainty of just 0.1 magnitude in the distance modulus, m-M.
Evidencia para um Universo em aceleração
One of the observational foundations for the big bang model of cosmology was the observed expansion of the universe. Measurement of the expansion rate is a critical part of the study, and it has been found that the expansion rate is very nearly "flat". That is, the universe is very close to the critical density, above which it would slow down and collapse inward toward a future "big crunch". One of the great challenges of astronomy and astrophysics is distance measurement over the vast distances of the universe.
Since the 1990s it has become apparent that type Ia supernovae offer a unique opportunity for the consistent measurement of distance out to perhaps 1000 Mpc. Measurement at these great distances provided the first data to suggest that the expansion rate of the universe is actually accelerating. That acceleration implies an energy density that acts in opposition to gravity which would cause the expansion to accelerate. This is an energy density which we have not directly detected observationally and it has been given the name "dark energy".
The type Ia supernova evidence for an accelerated universe has been discussed by Perlmutter and the diagrams below follows his illustration in Physics Today.
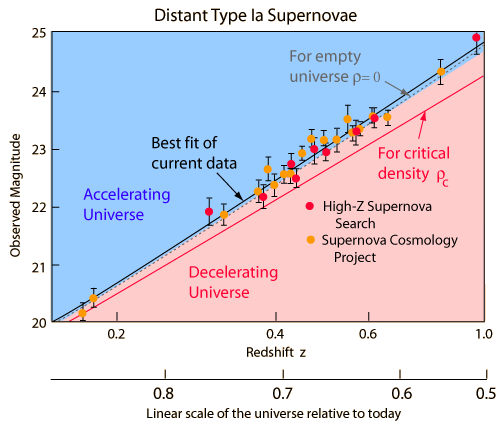
The data summarized in the illustration above involve the measurement of there dshifts of the distant supernovae. The observed magnitudes are plotted against the redshift parameter z. Note that there are a number of Type 1a supernovae around z=.6, which with a Hubble constant of 71 km/s/mpc is a distance of about 5 billion light years.

Sem comentários:
Enviar um comentário